
Spectrus Processor™: Process, Analyze, And Report All Your Analytical Data In One Interface

Spectrus Processor is a single software platform that processes and interprets all your spectrometric and spectroscopic data.
Work with Your Data from Anywhere
- Conveniently process and re-process data away from the instrument
- Simplify your software learning with just one interface to master for all your processing and analysis
Handle All Your Analytical Data in One Application
- Import data from different analytical techniques—NMR, LC/MS, GC/MS, HPLC, IR, Raman, etc.
- Support for most major instrument vendors, and industry-standard or open-source formats
Free-up Valuable Instrument Time for Data Acquisition
- When you’re not tied to processing your data on the instrument software it leaves the instrument free for data acquisition
Fast, Confident Answers from Assembled Analytical Data
- Easily assemble all related analytical and chemical information together
- Conveniently review complimentary characterization data together for faster decisions
Accelerate Data Analysis with Powerful Database Search Capabilities
- Search internally created and commercially available databases
- Review search results overlaid on query spectra. Color highlighting of matching signals makes for easy interpretation.
- Use chemically intelligent search—search by structure, substructure, spectral, and text-based parameters
- Get clarity and answer new questions with easy reprocessing and reinterpretation
Report with Ease
- Quickly create a comprehensive multi-technique report
- Customize report templates to suit your needs
- Assemble publication-ready data using popular journal templates
How it Works
Intuitive Tools for Working with All Your Analytical Data
- Drag and drop your data files into the interface
- Use the technique-specific functions to process your data—peak detect/peak pick, integrate, smooth, correct the baseline, generate XICs/TICs/TACs, and assign structure
- Evaluate structure/spectrum consistency for MS and NMR data
- Use included optical databases to assign peaks to structural fragments
- Report your analysis
Product Features
Features of Spectrus Processor
General
- Import data from >150 instrument vendor data formats
Review the list of supported formats - Perform manual and/or automatic data processing
- Assisted analysis and interpretation of spectral and spectrometric data
- Search commercial libraries or internally created databases (in ACD/Labs format)
- Create comprehensive multi-technique reports, with a single click
- Include annotated spectra and chromatograms, peak tables, interpretation/analysis notes, zoomed spectral regions of interest, chemical structures/structure fragments, reaction schema, and more
- Export results to Adobe PDF or copy/paste to Microsoft Word and PowerPoint
NMR
- Import 1D NMR data (1H, 13C, DEPT, etc.) and 2D NMR data (COSY, TOCSY, HMQC/HSQC/HMBC, NOESY, HETCOR etc.) from Bruker, Agilent/Varian, JEOL, and more
- Fourier transform, calibrate, peak pick, integrate, and carry out multiplet analysis
- Attach chemical structures to a spectrum for real-time visual feedback on peak/atom assignments
- Evaluate spectrum/structure consistency using quantitative NMR Match Factor values
- Search commercial spectral libraries or use the Known Structure Add-on for fast and efficient compound identification
- Generate formatted multiplet reports on the fly
MS
- Import LC/MS, LC/UV/MS, and GC/MS data from Agilent, Bruker, LECO, PerkinElmer, SCIEX, Shimadzu, Thermo Scientific, Waters, and more
- Detect peaks and generate extracted ion chromatograms (XICs), total ion chromatograms (TICs), and total absorbance chromatograms (TACs)
- Automatic extraction of relevant chromatogram from structure/formula/mass
- Automatic confirmation of mass/molecular formula
- Attach chemical structures and structure fragments to chromatographic peaks to evaluate consistency through color-coded ‘MS Match’
- Annotate spectral peaks with structure fragments
- Screen peaks/total spectra against spectral libraries to accelerate compound identification
- Comprehensive one-click reports, including annotated chromatograms and spectra
Chromatography
- Import chromatographic data from Agilent, Bruker, PerkinElmer, SCIEX, Shimadzu, Thermo Scientific, Waters, and more
- Peak detect, smooth, correct the baseline, and calculate peak areas
- Conveniently visualize chromatograms in a series
- Assign chemical structures to chromatographic peaks
- Create reports with structure assignments, method parameters, peak tables, annotations, and chromatograms
Optical
- Process and interpret data from a variety of optical techniques including:
- Infra-red spectroscopy (IR, NIR, FIR, MIR, UV-Vis)
- Absorption
- Raman
- Reflectance
- Fluorescence
- Phosphorescence
- Circular dichroism (CD)
- Spectroscopic ellipsometry
- Import data from Bruker, JASCO, PerkinElmer, Shimadzu, Thermo Scientific (Nicolet, Galactic), and more
- Process single and multiple spectra: baseline correct, peak pick, smooth
- Conveniently visualize spectral series
- Attach chemical structures to spectra and assign peaks to structural fragments
- Verify chemical structures using the knowledgebase of spectra-structure correlations or included content databases
- ST Japan IR Demo Library
- IRDEMO
- IR Assigned Polymers
- Raman Assigned Amino Acids
- One-click reports display key elements of your analysis
Other Techniques
- Handle a wide range of analytical data, including:
- EELS (Electron Energy Loss Spectra)
- Thermal analysis (DSC, DTA, TGA)
- DMA
- Calorimetry
- Titrimetric methods
- Voltametric methods
- X-ray methods (powder diffraction, fluorescence, and photoelectron)
- ESR spectroscopy
- Kinetics
- Perform various X- and Y-axis conversions and data manipulation manually or automatically
- Attach chemical structures to curves
- Conveniently visualize and compare series of related spectra
- Perform spectral based database searches
- Report your analysis with a single click
Deployment/Integration Options
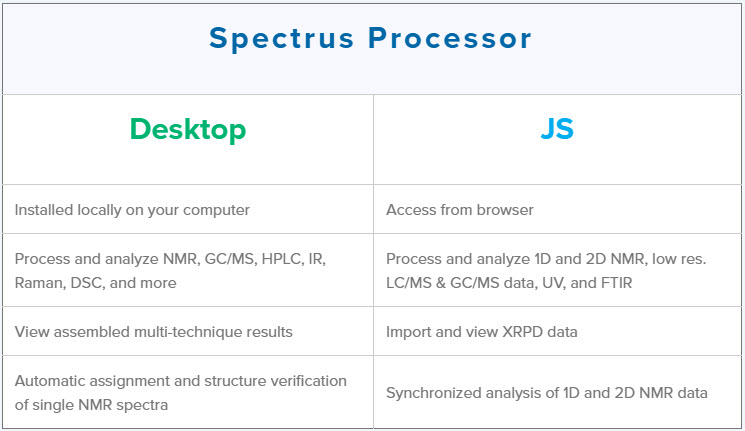
Spectrus Processor Users
Why Choose Third-Party Software to Process & Analyze Data?
With Spectrus Processor you can:
- Apply the same processing workflow and characterization tools to your data for consistency
- Easily switch between data collected on different instruments
- Future-proof your lab so you can change instruments without retooling your analysis workflows
- Reduce the overhead of training new colleagues on different software interfaces
Is Spectrus Processor Right for You?
Typical users of Spectrus Processor include:
- Analysts who run a variety of experiments and want to use one consistent interface to process and interpret data
- Organic/synthetic/medicinal chemists who want to process and analyze data at their desk, away from the instrument
- Spectrus Processor is successfully deployed in large and medium-sized R&D organizations with open-access labs, in companies with in-house service analytical labs, and in academic institutions
What’s New in v2025
What’s New in Spectrus Processor
- New parameters and metrics to support external standard qNMR workflows
- Customize the position of NMR integral curves
- Improved NMR baseline correction and 19F multiplet detection
- Additional NMR, LC, and MS formats supported with easier peak detection and reporting
What’s New in Spectrus Processor JS
- Process multiple MS or chromatography datasets simultaneously in separate browser tabs
- Improved component assignment across different XC/UV/MS datasets
- Improved chromatographic peak integration with manual peak splitting tool
- New Extracted Peaks Table widget for summarizing peak from individual extracted peaks