
A Procurement Framework For Evaluating Innovation Across Pharma R&D Suppliers
By Sourabh Mundra, Ph.D., Lead Analyst, Pharma R&D, Clinical and Preclinical Research, Beroe Inc.

Pharmaceutical companies are entering a period in which loss of exclusivity, portfolio concentration, and rising development complexity are converging. Between 2025 and 2030, the pharma industry will expose an estimated $230 billion to $300 billion of branded revenue to generic and biosimilar competition,1–3 Nearly 200 products lose exclusivity in this window, around 70 of them blockbusters.3 Capital and management attention are shifting toward differentiated science, externally sourced assets, AI-enabled development, and novel modalities with stronger probability adjusted value. The commercial consequence is well understood; however, the operational consequence of not realizing that revenue requires a step change in how quickly and how reliably external science can be brought into the enterprise. Traditional supplier evaluation on price, quality, delivery, capacity, and financial stability answers whether a supplier can execute reliably. It does not answer whether a supplier can improve the probability, speed, or value of a scientific outcome. This paper argues that the patent cliff has changed the mandate of R&D procurement. Three findings frame the argument:
- A report shows that the top 20 biopharma companies forecast their internal rate of return at 7.0% for 2025, up from 5.9% in 2024. Strip out GLP-1/GIP assets and average forecast peak sales per asset falls from $598 million to $353 million below the prior year. Average cost to develop an asset rose to $2.67 billion.4,5
- Pharmaceutical and life sciences M&A cleared $65 billion in Q1 2026 alone, the strongest quarter since 2020, with more than $16 billion biopharma deals. Cross-border licensing from China has moved from the periphery to the center of pipeline strategy, with average up-front payments rising from $52 million in 2022 to about $172 million in early 2026.6,7
- New approach methodologies (NAMs) are shifting preclinical demand, ICH E6(R3) is raising clinical quality standards, AI regulations are making model governance auditable, and the BIOSECURE Act is bringing supplier ownership into contracting decisions.8–11
This paper introduces a 100-point innovation partner assessment framework that scores R&D suppliers across scientific, technology, data maturity, translational, regulatory and quality readiness, and IP momentum. It is paired with a positioning matrix and evidence standard by score of the value each supplier can create. The objective is not to displace cost discipline but to place cost inside a definition of value that reflects the economics of pharmaceutical R&D.
Navigating The Patent Cliff: Pharma's Pipeline Challenge And Strategic Response
The patent cliff is a multiyear portfolio challenge extending through the late 2020s and early 2030s. Large revenue pools tied to blockbuster medicines are approaching loss of exclusivity, while generic and biosimilar competition can compress branded sales rapidly after entry. Unlike the 2011–2016 cycle, today’s patent cliff is concentrated in a few high-value biologics and specialty franchises that contribute disproportionately to company revenues. Table 1 below summarizes exclusivity timelines of some key molecules, revenues, and signal for sourcing procurement.
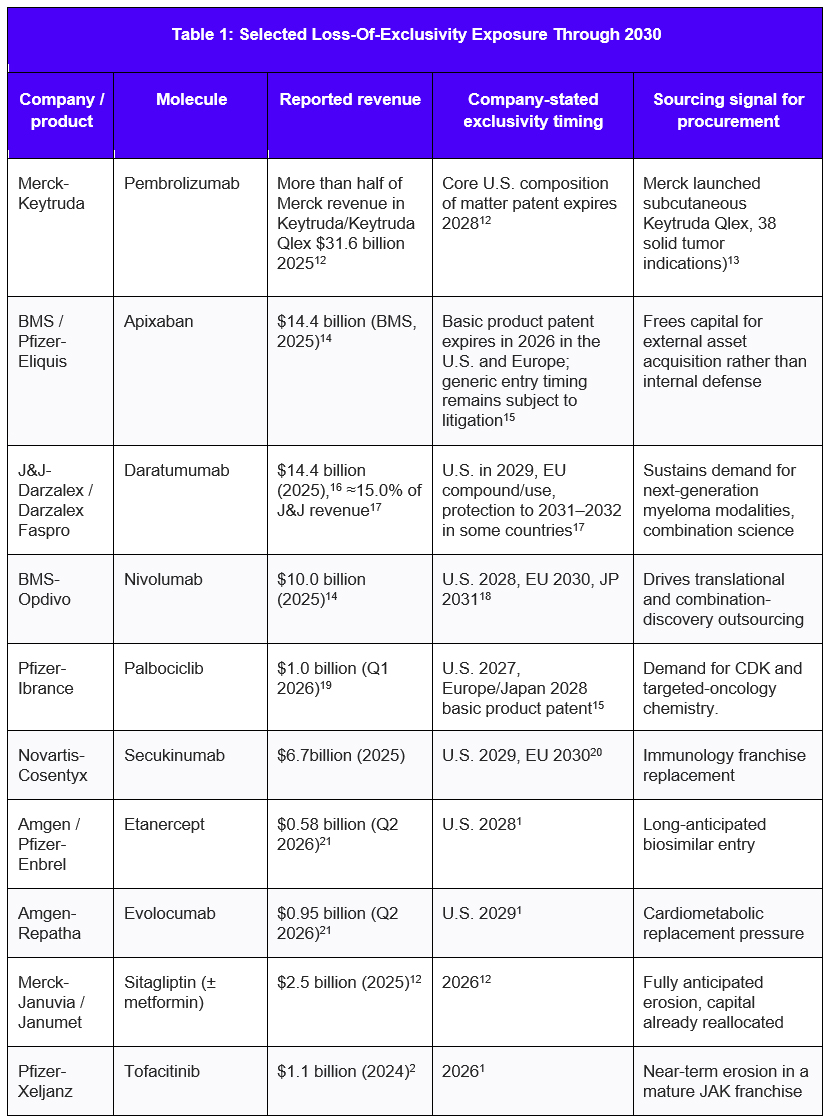
Sources: Merck, BMS, Johnson & Johnson, Pfizer, Novartis, Amgen, etc. annual reports. Exclusivity dates are company-stated estimates that litigation, patent-term extension, etc. may alter exclusivity.
Why Traditional Supplier Evaluation Falls Short
Traditional procurement scorecards focus on quality, delivery, service, cost, competitiveness, and financial stability. While essential, they often miss the factors that determine a R&D supplier’s impact on pipeline outcomes. Table 2 below demonstrates traditional metrics impact and its limitations.
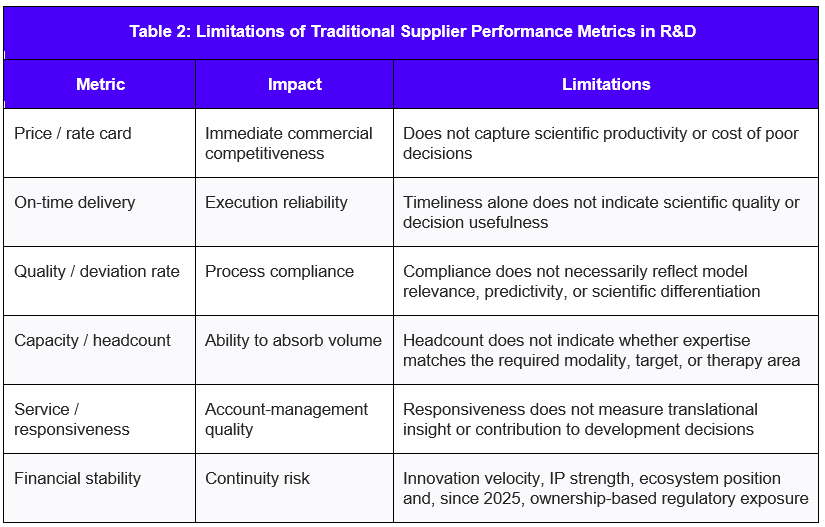
Sources: Secondary articles and Beroe analysis
To close this gap, procurement teams should expand supplier evaluation beyond traditional commercial and operational metrics by adding six R&D-specific innovation dimensions.
- Scientific capability: depth of therapeutic, modality, assay, chemistry, biology, and translational expertise
- Technology maturity: validated platforms, automation, digital infrastructure, AI deployment, and proprietary data assets
- Translational expertise: ability to connect preclinical evidence with biomarkers, human biology, patient selection, and clinical development
- Regulatory readiness: GxP maturity, validation practices, regulatory track record, and readiness of data for submission-grade use
- Innovation potential: patent estate, publications, proprietary methods, new platform launches, and evidence of continuous capability development
- Pipeline impact: demonstrated contribution to candidates entering the clinic, successful technology transfer, development acceleration, or probability-of-success improvement

The Innovation Partner Assessment Framework
This framework converts innovation from a qualitative impression into a structured, auditable procurement decision. It uses a 100-point weighted model. Table 3 below summarizes the innovation partner assessment framework based weighting.
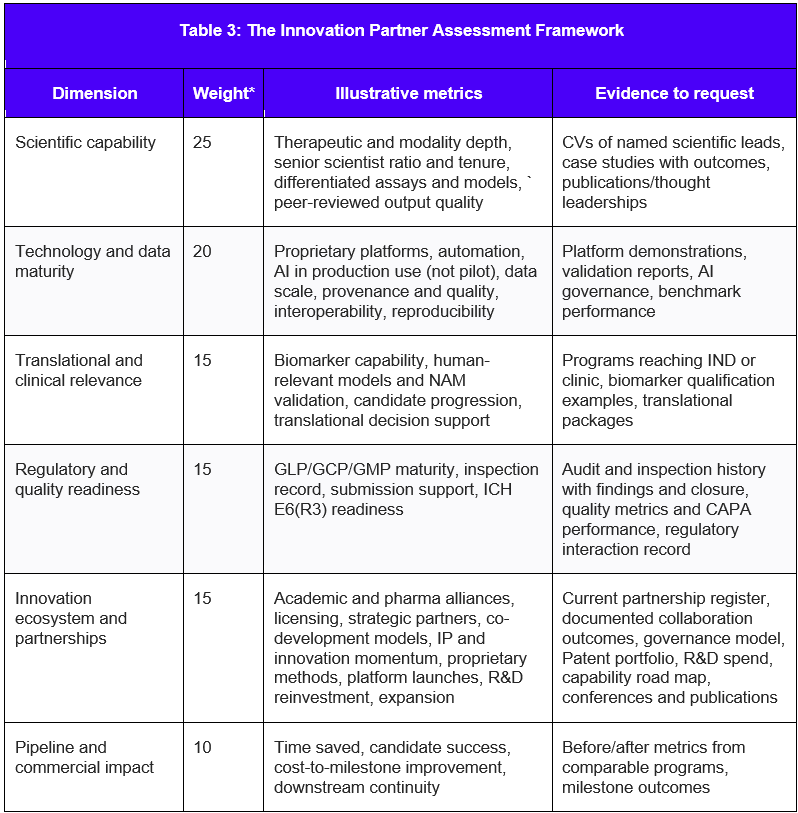
* Weights are indicative benchmarks that category teams can adjust based on their specific risk profile and spend concentration, rather than fixed or prescriptive standards.
Each dimension is rated on a 1–5 capability maturity scale and converted into its weighted contribution. This creates a comparable overall assessment while distinguishing between capabilities that are merely available and those that have demonstrated repeatable impact.
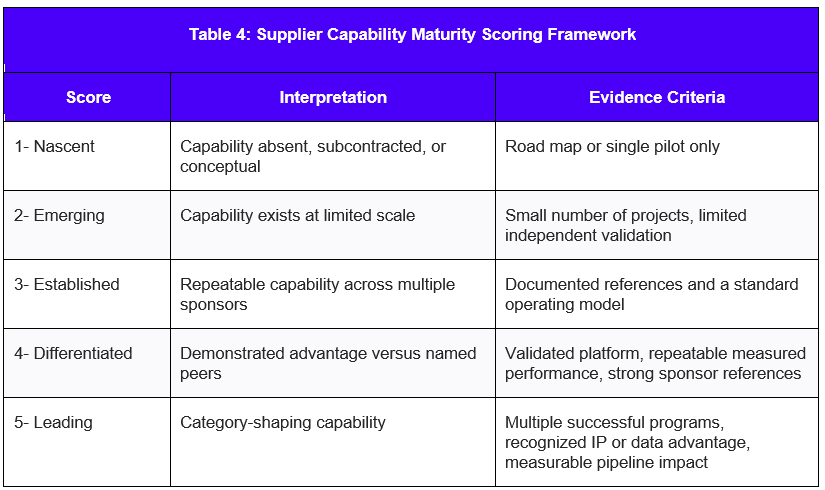
Sources: Secondary articles and Beroe analysis
Weighted supplier score = Σ [(dimension score ÷ 5) × dimension weight]
For example, a supplier receiving a score of 4/5 for scientific capability, weighted at 25%, would receive 20 points for that dimension. To make the assessment actionable, suppliers should subsequently be positioned according to two considerations such as innovation capability and operational maturity.
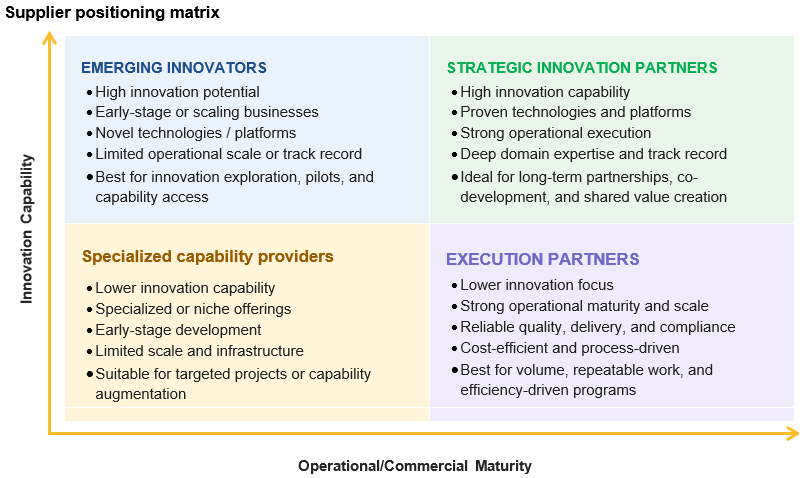
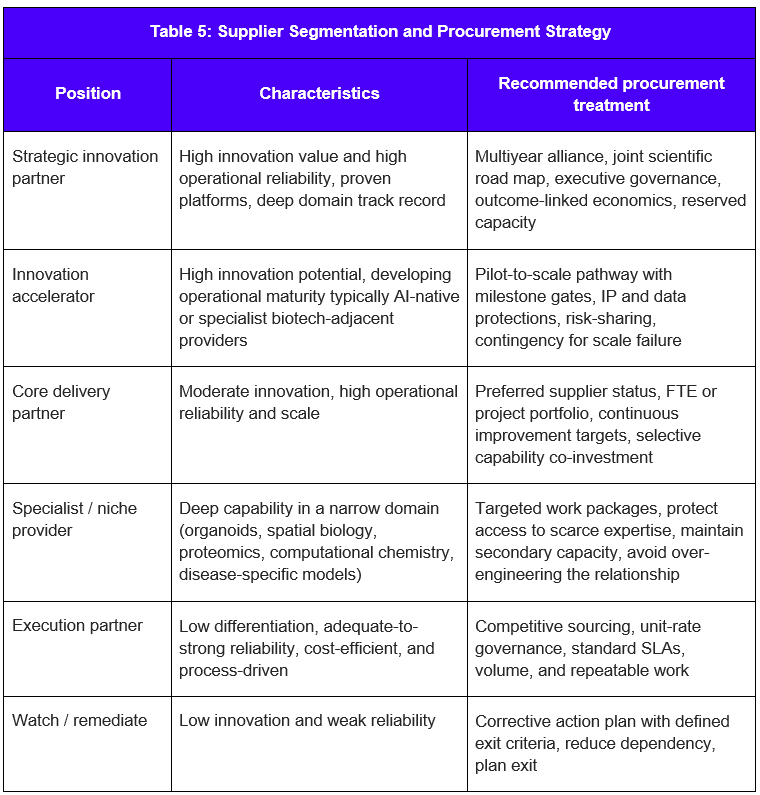
The positioning is not permanent; suppliers move through acquisition, platform launch, key talent departure, regulatory action, or designation. This helps procurement match each supplier’s role to the appropriate sourcing and relationship model as shown below in Table 5.
Sources: Secondary Articles and Beroe Analysis
Future Outlook
Over the next three to five years, R&D procurement is likely to evolve from supplier management toward active innovation portfolio management. As patent cliff pressure intensifies and pharmaceutical companies rely more heavily on external science, licensing, novel modalities, AI-enabled discovery, human-relevant models, and specialist technology platforms, supplier value will increasingly be measured by contribution to speed, probability of technical and regulatory success, and pipeline impact, rather than cost and delivery performance alone. Procurement teams will need dynamic supplier segmentation, stronger scientific and technical due diligence, and evidence-based measures of innovation performance. Strategic relationships are also likely to shift toward co-development, outcome-linked commercial models, reserved access to scarce capabilities, and joint technology road maps, while emerging innovators are managed through pilot-to-scale pathways that control operational, IP, data, and regulatory risk. At the same time, evolving requirements around AI governance, data provenance, regulatory readiness, supply chain ownership, and geopolitical exposure will make innovation sourcing more complex. The most effective R&D procurement organizations will therefore be those that can balance innovation access, scientific differentiation, operational reliability, regulatory defensibility, and cost, positioning procurement not simply as a buyer of R&D services but as an enabler of pipeline renewal and long-term portfolio value.
References
- GEN (Genetic Engineering & Biotechnology News), "Top 20 Drugs Heading for the Patent Cliff, 2026–2029," 1 November 2025.
- Drug Discovery News, "Blockbuster drugs face a massive patent cliff in 2026," February 2026.
- Fierce Pharma, "Large pharma companies reduced head counts by more than 22K in 2025 as $300B patent cliff looms," March 2026.
- Deloitte Centre for Health Solutions, "Measuring the return from pharmaceutical innovation, 16th edition: Navigating the GLP-1 boom," May 2026.
- Drug Discovery Trends, "Deloitte report showed pharma returns rising to 7%. GLP-1s did most of the work," May 2026.
- PwC, "Pharmaceutical and life sciences: US Deals 2026 midyear outlook," June 2026.
- Fierce Biotech, "Facing mounting China licensing costs, biopharma buyers turn to AI and local know-how to keep up," May 2026, citing Evaluate data.
- U.S. Food and Drug Administration, "Roadmap to Reducing Animal Testing in Preclinical Safety Studies," 10 April 2025.
- European Medicines Agency, "ICH E6 Good clinical practice- scientific guideline”.
- U.S. Food and Drug Administration, "Considerations for the Use of Artificial Intelligence to Support Regulatory Decision-Making for Drug and Biological Products," draft guidance, January 2025.
- Latham & Watkins, "BIOSECURE Act Becomes Law Limiting Grants With Biotechnology Companies of Concern," December 2025.
- Merck & Co., Inc., Annual Report on Form 10-K for the Fiscal Year Ended December 31, 2025.
- Merck & Co., "FDA Approves Merck’s KEYTRUDA QLEX (pembrolizumab and berahyaluronidase alfa-pmph) Injection for Subcutaneous Use," 19 September 2025.
- Bristol Myers Squibb, "Key facts" — FY2025 total revenues and worldwide product revenues.
- Pfizer Inc., Annual Report on Form 10-K for the fiscal year ended 31 December 2024.
- BioPharma Dive, "J&J eyes $100B in sales amid gains for cancer, immune drugs," 21 January 2026.
- Johnson & Johnson, Annual Report on Form 10-K for fiscal year 2025.
- Bristol Myers Squibb, Annual Report on Form 10-K for the year ended 31 December 2025.
- Pfizer Inc., “Quarterly Report (Form 10-Q) for the quarterly period ended Mar. 29, 2026,” U.S. Securities and Exchange Commission, 2026.
- Novartis AG, Annual Report 2025, Basel, Switzerland: Novartis AG, 2026.
- Amgen Inc., Amgen Reports Second Quarter 2026 Financial Results, 2026.
About The Author
 Sourabh Mundra is a lead expert with over 10 years of experience in research and commercial analytics, data-driven insights, competitive intelligence, and strategic planning across the pharmaceutical and healthcare sectors. He has led numerous market intelligence and advisory projects, integrating primary and secondary research with quantitative and qualitative methodologies to support global pharmaceutical companies in making informed strategic decisions. His work has contributed to optimizing category management, accelerating R&D initiatives, strengthening market understanding, and driving measurable business outcomes. He holds a Ph.D. in pharmaceutical sciences from Birla Institute of Technology and Science, Pilani, India. He has also delivered invited talks on pharmaceutical research, drug discovery, market intelligence, and emerging market trends.
Disclaimer: Strictly no photocopying or redistribution is allowed without prior written consent from Beroe Inc. The information contained in this publication was derived from carefully selected sources. Any opinions expressed reflect the current judgment of the author and are subject to change without notice. Beroe Inc. accepts no responsibility for any liability arising from the use of this document or its contents. For more information, please contact: info@beroe-inc.com.