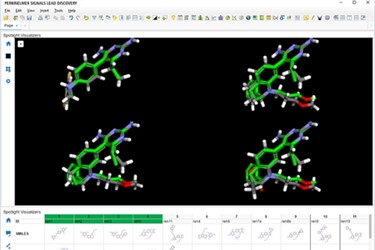
PerkinElmer Signals Lead Discovery

PerkinElmer Signals™ Lead Discovery lets researchers focus on science, not software. Powered by TIBCO Spotfire®analytics and visualization software, the Signals Lead Discovery platform frees researchers and scientists to explore the data they want, when they want, how they want.
A guided search and analytics experience leads to faster insight and decision making. Instant feedback on the availability and quantity of data reduces the time spent running queries, while the guided analysis workflow leverages industry best practices for discovery and insight. The intuitiveness of Signals Lead Discovery means more time for critical thinking.
Organizations and individuals can quickly gain new insights into chemical and biomolecular research data with PerkinElmer Signals Lead Discovery. Featuring guided search and analysis workflows and dynamic data visualizations for on-the-fly exploration, the platform is intuitive – letting researchers focus on their science, not on software.
Speed to Insight
Gain faster access to the data you need, when you need it. The agile guided search and query experience anticipates needs and provides the flexibility required.
Work that Flows
Bypass a steep learning curve with guided analysis workflows that really work for you.
Access More Data
Data is normalized, staged, and ready to explore. Mash up internal and external data without having to traverse internal data warehouses and ad hoc content from external partners.
Scalability
The horizontally scalable search platform provides your organization the search experience you demand, regardless of data volume and complexity.
With PerkinElmer Signals Lead Discovery, you can:
- Browse all the available data and decide on the fly which data to include in the analysis, along with feedback as to the availability of assay data.
- Gain immediate access to real time data and view the data in intuitive visualizations designed to identify patterns, trends and outliers within the data.
- Access internally obtained and publically available biology data in an environment that stimulates hypothesis development.
If your specialty is small molecule chemistry, you can also:
- Analyze compound series to identify R-groups of interest.
- Leverage Maximum Common Scaffold and Matched Pair Analysis to identify components that drive activity and/or ADME properties.
If your specialty is biologics, you can also:
- Easily visualize monomer changes in the biological sequences in the 3D structure of the biological molecule.
- Immediately fill aggregated SAR tables using the assay types you select on the fly.
- Easily identify similar biological molecules that succeeded or failed during the scale up process and look trends amongst the manufacturing data.
- Make better selections for constructs, strains, and growth conditions to improve the likelihood of manufacturing success.
- BLAST search to find molecules of interest and their related results.
