Using Quality Tools To Build A Cohesive R&D Environment
By Amy L. Lachapelle, QBD Strategies LLC

Developing products in the life sciences industries is complex. Basic quality tools can be used to bring the complexity into focus and help streamline the development strategy. These tools can help identify your primary goals and assess potential risks and failure modes to enable agile thinking early in development, where experimental outcomes often indicate the need to alter your development strategy. Using the basic quality tools in early-stage research and development also provides insight into the variability and criticality of product and material attributes and process parameters and helps manage your supply chain and outsourcing activities.
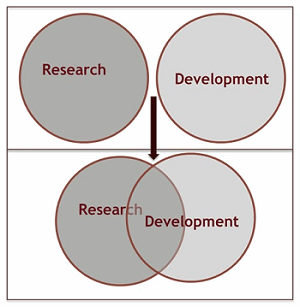
What is the difference between research, development, and R&D? Research and development teams need to understand the science behind their potential product and the technologies that will translate the science into a manufacturable product. R&D teams can be structured in a variety of ways, but effective research and development requires an integrated environment (Figure 1).

Figure 1: Where is "R" in "R&D"?
Pure research is the systematic investigation and study to establish facts and reach new conclusions. The facts and conclusions reached during investigational research that lead us to believe we can develop a useful product and the investigational approaches and results are the basis of our R&D activities. Development is considered to be the work that leads a potential product through a succession of stages, each of which is preparatory for the next, to make it useable. This definition implies a requirement to understand the outcomes of the earlier stage so they can be defined as inputs into the current stage of development. Research and development activities can be defined as the studies and tests that are performed in order to design new or improved products. By definition, R&D teams need to begin thinking in terms of the development process so the research component aligns with the overall development strategy.
Information silos occur when the needs of business units are not adequately conveyed to each other. Investigational research often occurs along with early product development, but the scientists working in these areas can have very different scientific approaches and goals. When R&D is viewed as a process, it becomes easier to integrate the work environment. The needs of early product development are represented and communicated as required inputs from the investigational research component. Rather than dissension, this promotes discussion of the current limitations of the project and ideas from multiple sources to overcome problems. The process approach will help build a cohesive team that has a more agile mindset capable of pivoting when necessary to achieve product development goals.
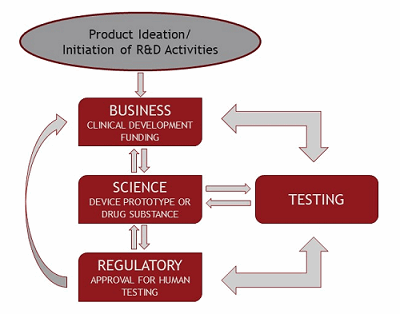
Flowcharts and process mapping create a visual understanding of your business, science, and regulatory needs and strategies. Different business units may not need to know all the details of the corporate strategy, but communicating the basics of the strategy enables teams to engage more proactively in achieving their individual goals with a vision of how their work output is incorporated into processes outside their area of expertise.
A simple flowchart creates a visual representation of the interactions among your business units. Figure 2 provides a simple flowchart of the relationships between the business, science, and regulatory aspects of a life sciences research and development project. It can be used to illustrate the interdependence of your business units and help promote communication between the units, as the chart identifies and clarifies individual processes and responsibilities.

Figure 2: Flowchart of Requirements for R&D Activities
Communication of needs can be further illustrated by developing process charts which incorporate the required inputs and outputs to the individual processes. Process charts further clarify needs and responsibilities of parties, promoting interaction between the members of research and development teams. The testing component of a new drug substance can be represented in a process chart as shown in Figure 3. The process chart can be used to document the process and its requirements and increase overall process understanding. It can be a great visual tool to troubleshoot research and development problems, because gaps can be more easily identified.

Figure 3: Drug Substance Testing Process
Using visual aids to describe corporate strategy and individual business processes promotes communication of ideas and results between teams. Rather than focusing on “research” and “development,” the process approach focuses on “R&D” (see Figure 1).
These flow- and process charts represent the target product profile. The target product profile (TPP) defines the requirements to commercialize a product. Business, science, and regulatory strategies should be designed to achieve the stage-appropriate commercialization requirements of the product.
The TPP identifies product and material quality attributes, process parameters, and formulation and packaging requirements. It is a critical tool for managing internal and external product development activities. Suppliers must be able to meet material quality requirements; contract organizations must be able to deliver processes and products that meet the specifications of the target product. These specifications and requirements should be part of your monitoring and measuring program to qualify your suppliers and outsourcing organizations, as well as your internal activities.
The flowchart in Figure 2 and the process chart in Figure 3can convey your corporate and scientific objectives quickly and easily to all interested parties. These quality tools create a visual road map to keep development activities on target and prevent delays in achievement of overall corporate goals.
Standardized documentation and reporting are necessary to ensure you have the information you need for knowledge retention and transfer. Process charts and the TPP designate defined inputs and measurable outputs. Data collection and reporting for these metrics must be standardized to retain the necessary data in the appropriate format. During R&D, the product concentration, strength, and its formulation may change from batch to batch, which may affect outcomes during drug substance testing (Figure 3). These need to be monitored to understand product/process variation and criticality of product attributes and process parameters.
Process charts can be used to document procedures, but written procedures detailing the activities are necessary to ensure control of the current state of product and process knowledge. There are high risks and costs associated with lack of proper knowledge retention. Written procedures ensure that new employees are trained to perform processes to current specifications. The availability of detailed written procedures allows for ease and reproducibility of technology transfer, whether internally to downstream groups or externally to outsource providers.
A cohesive R&D group can help bring focus to complex projects and streamline early-stage development. When needs and expectations are communicated throughout the entire group, everyone has a better understanding of the overall process. It becomes more obvious that failure to meet the needs of another team results in the failure to meet overall development goals. A unified research and development team will understand this and work together to discuss potential problems and approaches to solve those problems together.
Utilizing basic quality tools such as flowcharts and process charts can easily convey needs, responsibilities, and team interdependencies to interested parties. These provide the basis for opening discussion between business units, promoting more effective problem solving, and advocating teamwork to efficiently meet corporate goals.
About The Author:
 Amy L. Lachapelle is the founding partner of QBD Strategies, helping life science companies build robust research and development teams using best practices in quality management and scientific strategy. She has 16+ years’ experience in the biotechnology industry, working in the areas of protein replacement therapies, gene therapies, and analytical methods development. As director of protein services at GlycoSolutions Corporation, she was actively involved in continually improving the company’s cGMP quality systems and processes. Lachapelle is currently on the leadership board of the Quality Management Division of the American Society for Quality and is on the Advisory Board for the Mansfield BioIncubator. She has her CQA, a BS in Biochemistry, and an MS in applied mathematics. You can reach her at amy.lachapelle@qbdstrategies.com or connect with her on LinkedIn.
