
Early Implementation Of Quality By Design For Biological Product Development

By Amy L. Lachapelle, QBD Strategies LLC
The idea of thinking in terms of “operational excellence” is a relatively new idea for the biopharmaceutical industry. The enormous uncertainty associated with bringing a biological drug product from discovery to approval almost precludes the thought of forward-thinking in terms of what makes a quality product, especially during early-stage development. However, extensive product knowledge is gathered during early development, and crucial decisions are made in terms moving the science forward to generate the data required to meet your business objectives.
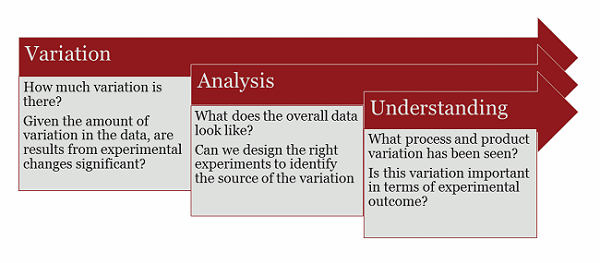
Figure 1: The process of changing variation into knowledge and understanding
QbD is a process, the end result being control of variation in product and process for consistent quality. But all processes must be implemented in stages, and for biological product development, the first stage is understanding the overall variation in your product and process. This is a prerequisite for criticality assessments and control measures. Good understanding of variation requires a lot of data, and this data is frequently generated in early development and preclinical work. Assessing the variation in a process based on one or two clinical batches is comparable to trying to understand variation in dinosaur species. As the famed paleontologist Jack Horner once said, “Unfortunately, with dinosaurs, we haven’t had enough specimens to determine how much variation there is within a species.”
Consider how frequently your company generates product through cell culture and various purification methods during the R&D phase, versus how many production batches are made for preclinical and clinical trials. The product and process data available from the R&D team more accurately depicts the potential variation than the few batches produced for preclinical and clinical trials. This data contains critical product knowledge and is a vital asset to your company. Understanding how this data transforms into knowledge of the total expected variation in product, process, and expected experimental outcomes involves knowing the statistical distribution of your data. Unfortunately, this distribution cannot accurately be determined from the minimum three points. Fortunately, there is a lot of data stored away that can be used to assess the true distribution.
Variation Affects Process, Product, and Experimental Outcome
QbD is being successfully implemented in many pharmaceutical industry processes, and a number of approvals including generics, chemical entities, and monoclonal antibodies have now been submitted utilizing the quality by design approach.1 That said, implementing quality by design for biologics is complex, due to the increased complexity of both the manufacturing process and the product.
The manufacturing process includes the complexity of cell culture at multiple scales, followed by multiple filtration and chromatography steps to obtain a product with sufficient purity. The biological product itself is highly heterogeneous, due in part to the many types of post-translational modifications found on proteins and changes that can occur to these modifications due to changes in process. This effect of process on product attributes is the reason why, for biologics, the “process defines your product.”
Biological product development is further complicated due to the inability to fully characterize the molecule. Chemical entities can be fully characterized using a few analytical methods. Many of their properties, such as solubility, can be predicted based upon their structure. This is not true of biologics. Multiple analytical and cell-based assays need to be developed simultaneously with product development to evaluate the molecule’s characteristics, such as charge and glycosylation heterogeneity, as well as activity levels. Biologics can be very sensitive to pH, buffer composition, and storage conditions.
During R&D, process, product, and experimental data can be highly variable, and this variation is the sum of variation in process, storage, and analytical and experimental variation. Valuable insight into potential critical process parameters and product attributes can be gained by tracking not only how your molecule was produced and stored, but also by tracking variables in the analytical and cell-based methods used to characterize the product.
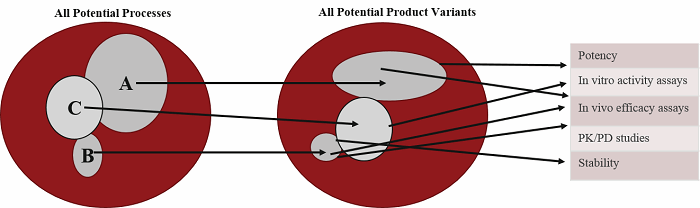
Figure 2 — Effects of Variation on Outcomes: Different process parameters can produce a product that possesses a subset of expected variants. The nature of the variants can have an effect on characterization studies. Experimental methods at this stage can also give variable results. Linking process, product, and experimental variables and outcomes can provide early information on criticality.
As an example, assay variation in protein concentration and purity will lead to variation in potency or activity measurements. The activity determination is then used to determine dosing in animal studies. Accurate interpretation of study results needs to involve understanding of the reproducibility of the individual steps. Decisions are frequently made early based on a minimum number of experiments. As shown in Figure 2, misleading conclusions can be drawn without adequate knowledge of the nature of the experimental variability. Considering that Phase II and III attrition rates are approximately 60%, and most of these failures are due to lack of safety and efficacy, successful product development requires that laboratory results can be replicated in preclinical studies, and that preclinical results will translate to clinical results. This requires that all your procedures are reproducible.
Data Analysis
Consider that, statistically, 95% of your experimental results will fall within two standard deviations of the mean. Results can be highly variable during development of processes, analytical methods, and bioassays. Typically, development work proceeds using “one factor at a time,” or OFAT, experimentation. If you are working on developing a new process that has an actual distribution of 80% yield with a 10% standard deviation, each time you perform that process, your results will fall within 80% to 100% yield almost 48% of the time. If you have made a change that results in a 95% yield, the temptation to conclude that the change is significant is strong, but statistically, it is equally possible that this conclusion is wrong.
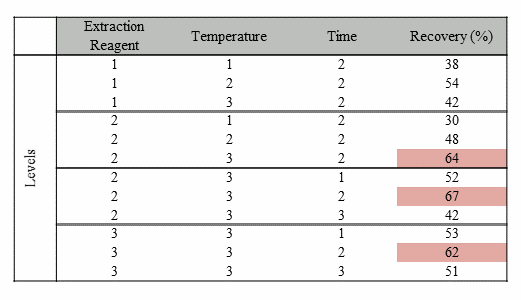
Consider the set of experiments performed in Table 1. A total of 12 experiments were performed to determine the optimal conditions for product recovery. The three experiments showing the highest recovery indicate that the optimal conditions are as follows: middle amount of extraction level, highest temperature, and middle extraction time.
Table 1: Example Data From a Series of OFAT Experiments
Visualization of the data using some simple statistical tools quickly yields more understanding of the factors that influence the results. The box and whiskers plots (boxplots) on the top of Figure 3 very clearly show the factor effects, as well as the variation, for better understanding of the data. The linear regression models are shown in the lower panel of Figure 3. The linear models indicate that temperature is the only significant factor. (Regression statistics are not shown.) The regression models predict that temperature accounts for 56% of the variation, the concentration of extraction reagent accounts for 13% of the variation, and time is an insignificant factor. Both the boxplot and regression analysis clearly show that more effort should be put into studying the temperature effect in hopes of improving recovery, whereas time and concentration of extraction reagent can be minimized to reduce the cost of the reagents used and to maximize efficiency.
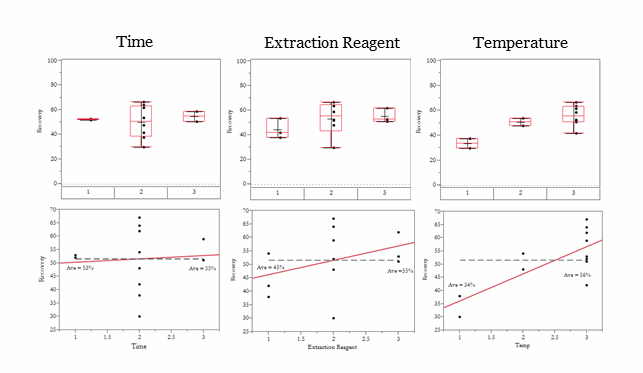
Figure 3 — Comparison of Boxplot and Regression Analysis of Experimental Data: The combined data from experiments 1 and 2 were plotted using boxplots (upper panel) and linear regression (lower panel). The numbers in the bottom axis of the boxplot indicate the level of the factor. The box for each factor shows the data between the upper (25%) and lower (75%) quartiles. The dividing line inside the box indicates the median of the data, and the “whiskers” show the high and low values of the data with the outliers excluded. Any point seen above or below the whiskers indicates a potential outlier and should be investigated.
Stop, Think, and Plan
The factors involved in a process are often known. Consider the example in the previous section. Three factors were studied over the course of 12 experiments. Often, we are pushed to get results quickly and bypass the planning process that involves the potential for unexpected outcomes, since we “know” the one factor that needs to be studied. But this approach often results in incomplete knowledge on how the process performs.
Using the previous example, the factors involved in the process are known. A simple design of experiments could have been performed to minimize the number of experiments yet provide information on the size of the effect of each factor and also any potential interactions. For this particular example, a full factorial design would need eight experiments (2n where n is the number of factors) run at both the low levels and high level of each factor. The results of the designed experiments would yield not just data where optimal conditions are chosen based on a table of results, but knowledge about the factors that most influence the process and any potential positive or negative interactions between factors that need to be controlled. In short, this approach yields knowledge and understanding that can be transferred across teams for more efficient development.
Scientific Strategy
It is well known that lack of safety and efficacy are the most common causes of drug failures in clinical trials. In 2013, Pfizer established a team to perform a root cause analysis of attrition rate in hopes of better understanding how to select drugs that would proceed to clinical trials. Their initial focus was on Phase III clinical trials, but their root cause analysis led them backward through the development phases to key preclinical activities. In short, they found that poorly designed experiments or faulty statistical analyses led to “false confidence in the effectiveness of their chosen compound.” They found that there was a need to improve study design, robustness, reproducibility and quality in their preclinical research.2
In response to the study, Pfizer developed an Assay Capability Tool to help develop preclinical assays that improve the reproducibility and quality of their preclinical research. The tool focuses on three critical areas:
- The need for clear objectives with specified decision criteria for the measure of successful outcomes
- An understanding of the assay variation so that pre-defined precision criteria can be met
- Minimization of bias by ensuring that experimental and statistical techniques are defined in a working protocol for objective analysis
Conclusion
Pfizer’s approach to improve the quality of its preclinical research is an example of early implementation of the building blocks of QbD. The requirements for protocols, prior definition of successful outcomes, and objective data analysis yields solid product knowledge that can easily be transferred across the company.
The principle of quality by design is based on knowledge (both literature and prior research) and sound scientific strategy. The utilization of this approach is strongly recommended in the ICH Q8(R2) guideline for pharmaceutical development. It states that “a more systematic approach to development (also defined as quality by design) can include, for example, incorporation of prior knowledge, results of studies using design of experiments, use of quality risk management, and use of knowledge management (see ICH Q10) throughout the lifecycle of the product. Such a systematic approach can enhance achieving the desired quality of the product and help the regulators to better understand a company’s strategy.”3 The guideline advocates early establishment of a quality target profile that contains, at minimum, quality, safety, and efficacy requirements.
The idea of understanding product and process variation is especially important in biological product development since the process, product, and clinical populations are inherently variable. Transforming early data into knowledge about this variation can provide your company with a critical asset that facilitates technology transfer and decision-making. It enables knowledge flow and makes your company less vulnerable to loss of knowledge through change of personnel or transfer of technology through the pipeline.
References:
- See www.qbdworks.com for a comprehensive list of case studies and references.
- Katrina Gore, Phil Stanley. 2015. "Getting our ACT together." Significance (The Royal Statistical Society) 36-38.
- FDA. 2009. ICH Q8(R2) Pharmaceutical Development. November. http://www.fda.gov/downloads/Drugs/.../Guidances/ucm073507.pdf.
About The Author
Amy Lachapelle created the protein characterization group at GlycoSolutions. Her primary focus was to develop the analytical technologies for a wide range of applications and to work directly with clients to develop and streamline analytical strategies for product characterization.
Amy also acquired a wealth of knowledge during her years at Genzyme. There she assisted with the feasibility study of a protein replacement therapy for cystic fibrosis and was involved in the R&D initiative for gene therapy projects. Her duties involved the purification and characterization of a membrane protein, the monoclonal antibodies required for R&D efforts, as well as the adenoviral and AAV gene therapy vectors.
QBD Strategies was founded to help early-stage companies develop strategic scientific approaches toward the development of their product, with the aim of getting statistically significant data for their product as well unbiased technical risk assessments. This approach provides data that can be augmented throughout development, resulting in more knowledge of product qualities, identification of knowledge gaps, ease of technical transfer, and an overall competitive edge for the product.